Design Methodology Overview
The design methodology for the Data Center Intelligent Fresh Air and Efficient Cooling Integrated Solution follows a systematic, iterative approach that ensures all technical, operational, and business requirements are met while optimizing for energy efficiency, reliability, and total cost of ownership. This chapter outlines the complete design process from initial requirements gathering through final validation.
2.1 Design Process Framework
The design process consists of six major phases executed in sequence, with feedback loops allowing for refinement and optimization at each stage. The phases include Requirements Analysis, Conceptual Design, Detailed Design, Simulation and Validation, Documentation, and Design Review and Approval.
2.1.1 Requirements Analysis Phase
The requirements analysis phase establishes the foundation for all subsequent design work. This phase involves comprehensive data collection including IT load profiles (current and projected), environmental parameters (outdoor climate data, indoor temperature and humidity requirements), reliability requirements (uptime targets, redundancy levels), energy efficiency targets (PUE goals, natural cooling hours), and budget constraints (capital expenditure limits, operational expenditure targets).
Key deliverables from this phase include a Requirements Specification Document detailing all functional and non-functional requirements, a Load Profile Analysis showing hourly, daily, and seasonal variations in cooling demand, and a Climate Analysis Report providing outdoor temperature and humidity data for natural cooling feasibility assessment.
2.1.2 Conceptual Design Phase
The conceptual design phase translates requirements into high-level system architecture. This involves selecting the appropriate cooling topology (centralized vs. distributed, room-level vs. row-level), determining the fresh air strategy (economizer type, mixing ratio), establishing the control philosophy (centralized vs. distributed, autonomous vs. coordinated), and defining redundancy architecture (N, N+1, N+2, 2N).
2.1.3 Detailed Design Phase
The detailed design phase develops complete technical specifications for all system components. This includes equipment selection and sizing based on detailed load calculations, ductwork and piping design with pressure drop analysis, electrical system design including power distribution and control wiring, control system design with detailed logic diagrams and I/O lists, and integration design for BMS, fire alarm, and security systems.
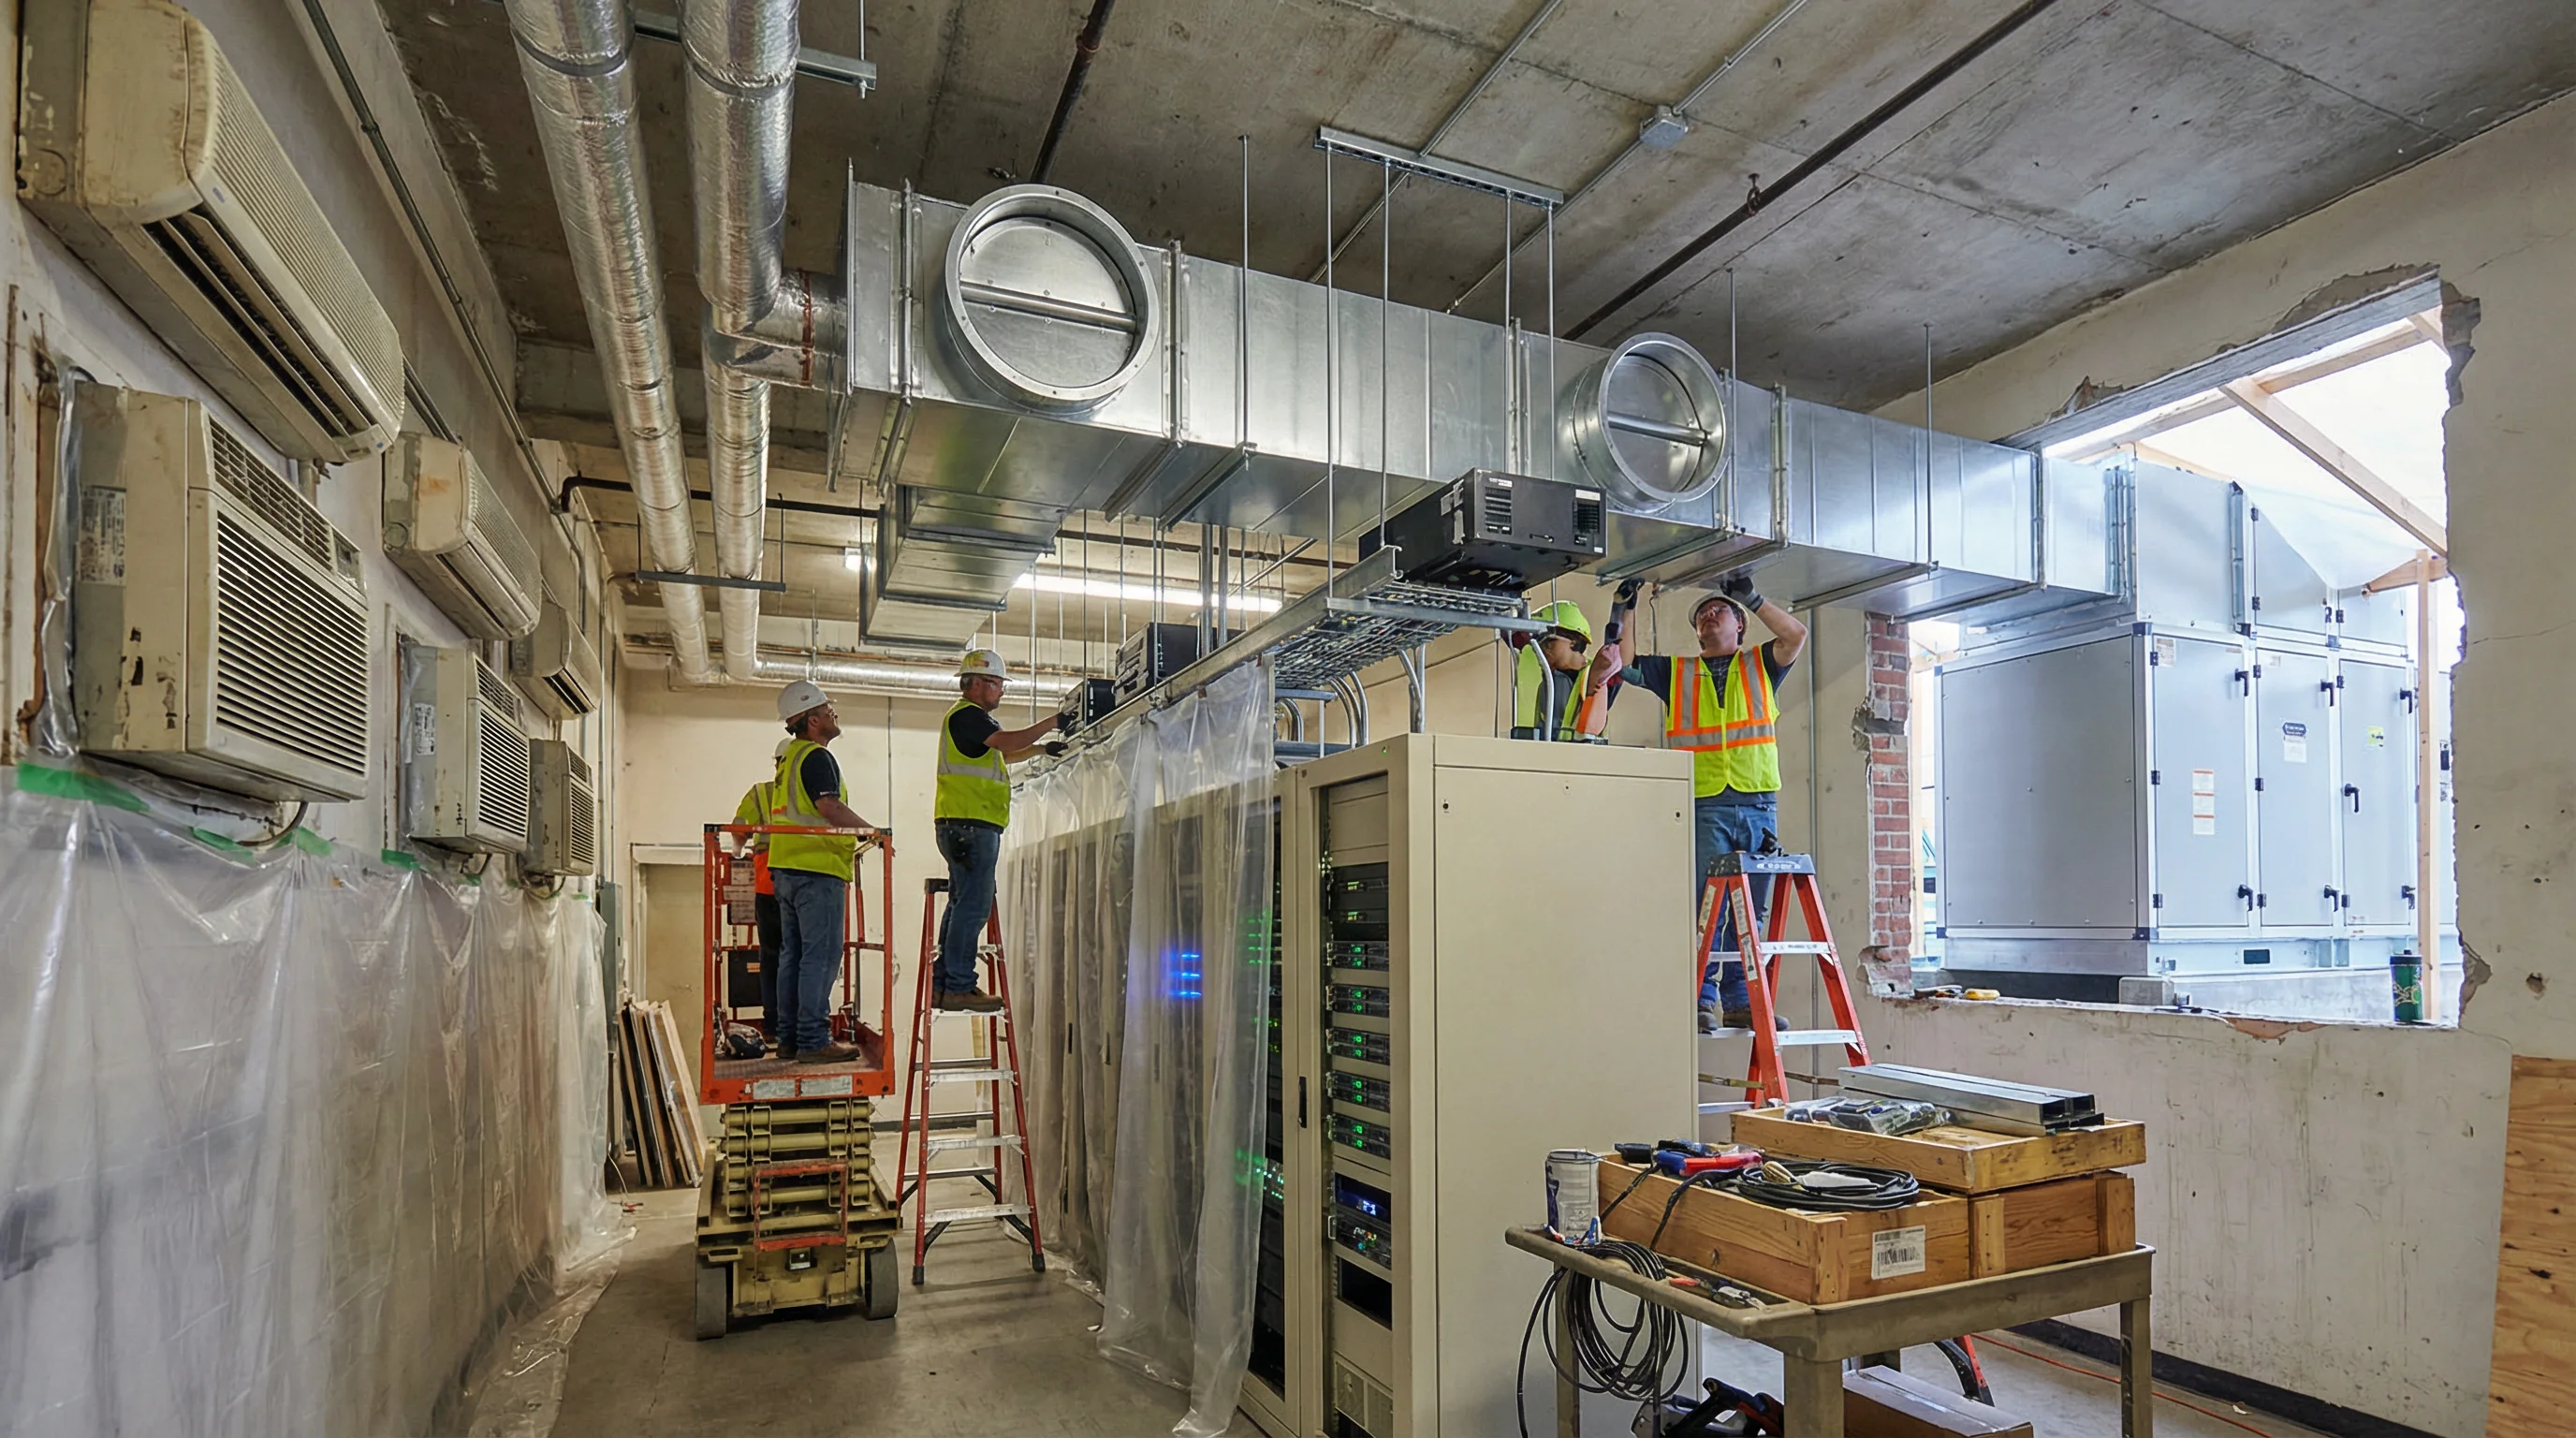
Figure 2.1: Retrofit Project Showing Integration of New Fresh Air System
2.2 Load Calculation Methodology
Accurate load calculation is critical for proper system sizing. The methodology accounts for multiple heat sources and applies appropriate safety factors.
2.2.1 IT Equipment Heat Load
The IT equipment heat load is calculated based on the nameplate power rating of all servers, storage, and network equipment, adjusted by utilization factors. The formula is: Q_IT = Σ(P_rated × U_factor × N_units) where P_rated is the nameplate power per unit, U_factor is the utilization factor (typically 0.6-0.8 for servers, 0.7-0.9 for storage), and N_units is the number of units. A diversity factor of 0.85-0.95 is applied for large deployments to account for non-simultaneous peak loads.
2.2.2 Facility Heat Load
Facility heat loads include lighting (typically 5-10 W/m² for LED lighting), UPS losses (typically 5-8% of IT load), PDU losses (typically 2-3% of IT load), and building envelope heat gain through walls, roof, and windows calculated using U-values and surface areas.
2.2.3 Safety Factors and Peak Load
A safety factor of 1.15-1.25 is applied to the total calculated load to account for uncertainties, future growth, and transient conditions. The peak design load becomes: Q_design = (Q_IT + Q_facility) × Safety_factor. This peak load determines the required mechanical cooling capacity.
2.3 Natural Cooling Potential Analysis
Natural cooling potential is assessed by analyzing the number of hours per year when outdoor conditions allow for free cooling without mechanical refrigeration.
2.3.1 Climate Analysis
Historical climate data (minimum 10 years) is analyzed to determine the frequency distribution of outdoor dry-bulb temperature and wet-bulb temperature. This data is typically obtained from local meteorological stations or international climate databases such as ASHRAE climate data.
2.3.2 Free Cooling Hours Calculation
Free cooling hours are calculated by comparing outdoor conditions against the data center's supply air temperature requirements. For direct air economization, free cooling is possible when outdoor temperature is below the supply air temperature minus a differential (typically 5-8°C). For indirect economization (using cooling coils with outdoor air), free cooling is possible when outdoor wet-bulb temperature is below the chilled water supply temperature minus approach temperature.
2.4 Airflow Design Methodology
Proper airflow design ensures uniform temperature distribution and prevents hot spots while minimizing fan energy consumption.
2.4.1 Airflow Rate Calculation
The required airflow rate is calculated based on the sensible heat load and the allowable temperature rise: Q_air (m³/h) = Q_sensible (kW) / (ρ × Cp × ΔT) where ρ is air density (1.2 kg/m³ at standard conditions), Cp is specific heat of air (1.005 kJ/kg·K), and ΔT is the temperature rise across IT equipment (typically 10-15°C for cold aisle to hot aisle).
2.4.2 Duct Sizing and Pressure Drop
Ductwork is sized to maintain face velocities within recommended ranges (4-6 m/s for main ducts, 2-3 m/s for branch ducts) to minimize noise and pressure drop. Total pressure drop is calculated by summing friction losses in straight duct sections and dynamic losses at fittings, dampers, and coils. The total pressure drop determines the required fan static pressure capability.
2.5 Control Strategy Design
The control strategy defines how the system responds to changing conditions to maintain environmental parameters while optimizing energy efficiency.
2.5.1 Temperature Control Strategy
A cascaded control strategy is employed with supply air temperature as the primary controlled variable and cold aisle temperature as the secondary variable. The controller modulates fresh air dampers, fan speeds, and mechanical cooling capacity in sequence to maintain setpoints while maximizing natural cooling utilization.
2.5.2 Humidity Control Strategy
Humidity control is typically passive, relying on the natural moisture content of outdoor air and the dehumidification effect of cooling coils. Active humidification is only employed when outdoor air is excessively dry (RH < 20%) and active dehumidification when outdoor air is excessively humid (RH > 80%).
2.6 Redundancy Design
Redundancy design ensures system availability meets the data center's uptime requirements. Common redundancy configurations include N+1 (one additional unit beyond minimum required), N+2 (two additional units), and 2N (fully redundant parallel systems). The choice depends on the data center tier level and business criticality.
| Redundancy Level | Configuration | Availability Target | Typical Application |
|---|---|---|---|
| N | Minimum required capacity, no redundancy | 99.671% (28.8 hrs downtime/year) | Tier I data centers, non-critical applications |
| N+1 | One additional unit beyond minimum | 99.741% (22.7 hrs downtime/year) | Tier II data centers, standard enterprise applications |
| N+2 | Two additional units beyond minimum | 99.982% (1.6 hrs downtime/year) | Tier III data centers, mission-critical applications |
| 2N | Fully redundant parallel systems | 99.995% (26 min downtime/year) | Tier IV data centers, fault-tolerant applications |